Catch and Release Lab
Collaborators- Cammy Day, Caleb Coyle, the entire 1st block APES class...
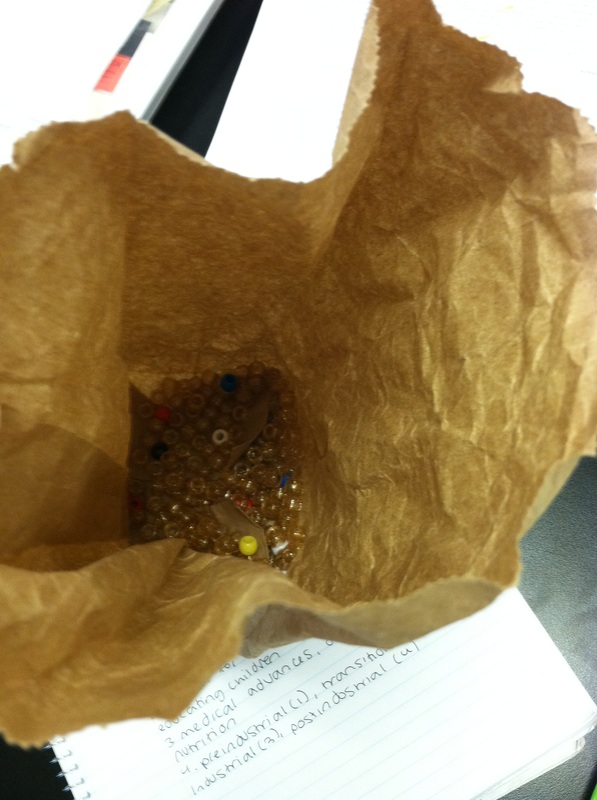
Abstract- An experiment was conducted to simulate the catch and release method used to calculate population. The experiment used a bag with a certain number of fish (white beads) and twenty of which were the "tagged fish" (colorful beads). A handful of the beads, which simulated a full fishing net, were to be taken out ten times and the percent of tagged fish per catch was to be calculated. Afterwards, using the average percent amount of tagged fish per catch, the population size was estimated at about 200 fish. The actual population size was 185 fish, meaning that the catch and release method is an accurate way to calculate population. Afterwards, results were pooled from 14 other groups; all with varying amounts of tagged fish, total number of catches, total populations, and % error results. It appears that the groups with lower amounts of tagged fish and fewer catches were able to calculate populations more accurately.
Problem- According to Michael J. Gregory, Ph.D., "special techniques may be required to measure animal populations... which enable investigators to estimate numbers of animals without having to census an entire population." Using the tagging method commonly used by biologists, determine which catch size and number of catches yields an accurate estimate of a population size.
Hypothesis- If the percent error of population estimates using different catch sizes and numbers of catches is measured, then it will be found that a larger catch size and larger number of catches yield less accurate results.
Parts of Experiment- Independent- the number of tagged fish and number of catches
Dependent- the percent error
Control- total population of fish
Experimental- the population estimate
Materials- 185 beads of one color and 20 beads of another color
Paper bag
A hand capable of grabbing beads
Methods-
1. Remove a sample catch of 10, 20, or 30 beads from the paper bag
2. Replace the sample catch with different color beads to represent the tagging
3. Shake the bag and randomly draw out a handful of beads
4. Do this either 10, 15, or 30 times while being sure to record the total number of beads withdrawn and how many of them were tagged
5. Calculate the percent tagged for each catch and average them together
6. Use this number to estimate the population size (population size = number tagged / mean of the sample percentages)
7. Record the actual population size and then calculate the percent error
Data- (click on images to see whole)
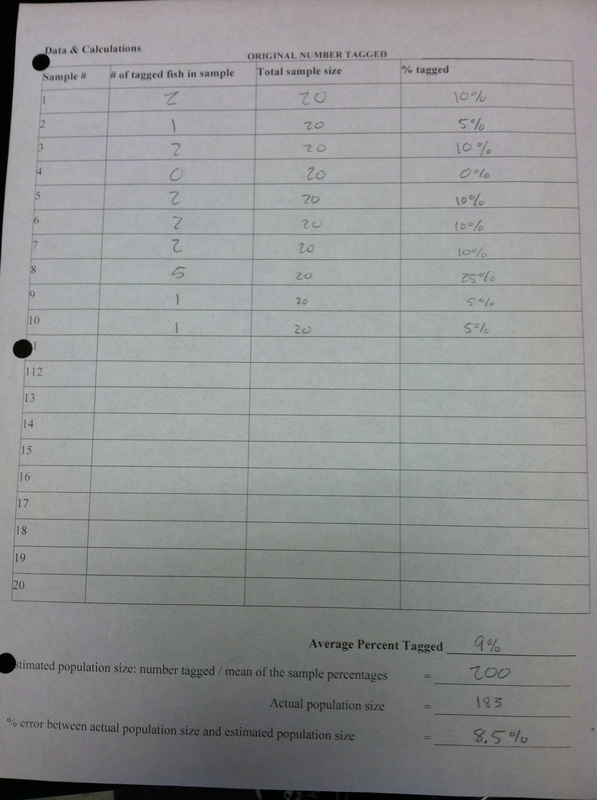
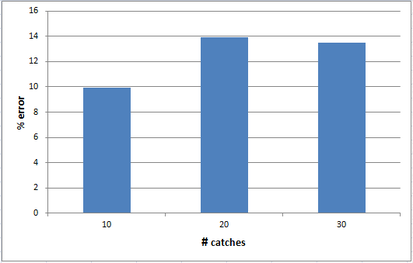
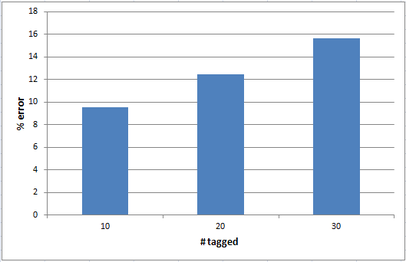
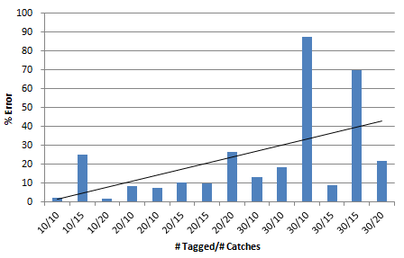
Data Analysis- In the individual group data, this group had a combination of 20 tagged fish and 10 catches and it only had a 9% error. When looking at the class averages, it appears that, as the number of tagged increases, the percent error increases as well. This means that tagging more fish means you get a less accurate population estimate. The same can be said for the number of catches. So the more catches that are done, generally, the less accurate the population estimate will be. The two variables combined supports the same trend that more tagged and more caught equal less accuracy, even when the outliers are omitted.
It is also of note that the data supports the idea that number tagged is a more influential factor than number of catches, as the percent error changes two percent more on the graph with number tagged. In other words, the percent error changes about six percent as the number of tagged increases from 10 to 30 while the percent error only changes four percent as the number of catches increases by the same amount.
Conclusion- The results support the hypothesis. Tagging more fish and doing more catches would create a less accurate population estimate. The reason for this being that when using the catch and release method, there will be outliers, and with more tagged fish and more catches, the more likely it will be for the outliers to skew the data and increase the percent error. A high amount of tagged fish can be countered by large catches, with high amounts of "fish" in each catch, but the amount of catches should remain low to keep the data as accurate as possible.
Citations-
Gregory, Michael J. "Estimating Animal Population Size Using Mark-Recapture
Techniques."Clinton Community College. N.p., n.d. Web. 05 Nov. 2013.
<http://faculty.clintoncc.suny.edu/faculty/michael.gregory/files/ENV 101/ENV 101
Laboratory/Mark-Recapture Sampling/lincoln instructions-dried bean
version.htm>.
